
HALLO
Learn more - Forest plot, funnel plot, pooled measures
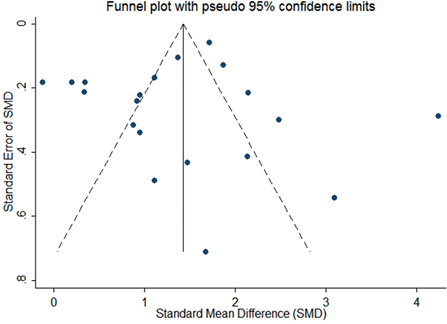
A funnel plot is a graphical check for publication bias. In the absence of publication bias, the largest studies are plotted near the average, and smaller studies are evenly spread on both sides of the average, creating a funnel-shaped distribution. Deviation from this shape can indicate publication bias.
Look at the funnel plots bellow. Which one indicates publication bias?